
Teaching How to Use Python in Excel: Part 1 – First Attempt

The admin read an interesting article related to Python in Excel, especially for those who are trying it for the first time. The article discusses teaching Python in Excel from the basics, even for those who have little prior knowledge of Python. The author, though not an expert, shares their experience using both programs.
The integration of Python directly into Excel by Microsoft is considered very exciting by the author, similar to their excitement when they first used Power Query. It adds immense capabilities to analyze and present data, making learning a new skill enjoyable.
Tip: You can use AI like ChatGPT to help you write Python code because Python is the most suitable computer language for ChatGPT, offering more precise and accurate answers compared to other languages (especially better than Excel formulas).
How to Register for Python in Excel:
Currently, you need Excel 365 and must subscribe to Excel 365 Insider (which is free to subscribe on the Account page). You must choose the Beta Channel option to use Python in Excel. Please note that some users might need to wait a bit even after subscribing.

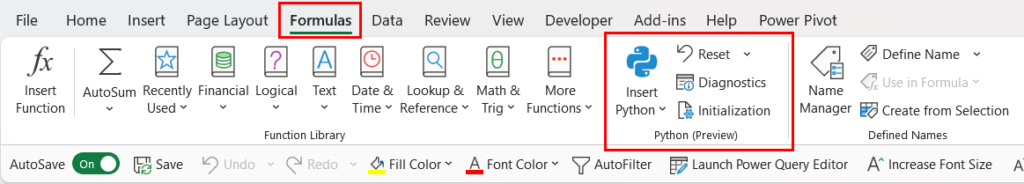
Once you can use it, a new tool will appear in the Excel Ribbon under the Formula tab.
How to Use Python in Excel
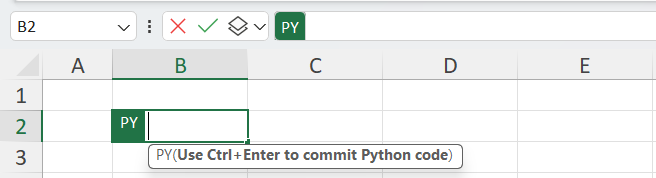
You can use Python in Excel by typing the following formula into any cell: =PY and then press Tab. This will immediately enter “Python Code Writing Mode” (or you can press Ctrl+Alt+Shift+P, but I prefer =PY).
Running Python Code
When you write Python code, pressing Enter will simply create a new line (because code often spans multiple lines). If you want to run the code, press Ctrl+Enter instead.
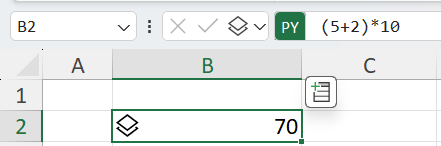
You don’t need to start with an equals sign when writing Python code; you can type the code directly. For example, you can enter.
(5+2)*10
and then press Ctrl+Enter to run the Python code. It will send the data to run on the cloud (meaning you need an internet connection).
Results of Python in Excel
Python in Excel provides two types of results: Python Objects and Excel Values.
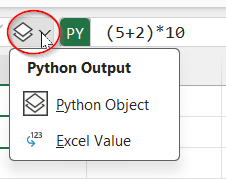
The default is Python Objects, which can hold multiple pieces of data within one object.
If the result is a single value, like 70, it will be displayed immediately.
However, if the result is a complex data structure with multiple values, it might not display immediately but show as an object, like a list, record, or DataFrame. For instance, you can create a Python list like
[5, 20, "cat", "สาว"]
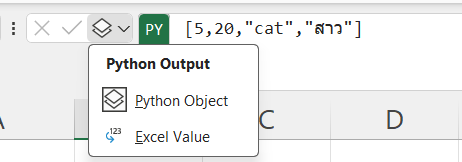
You can change the result to Excel Value, and it will display in Excel cells as usual. If there are multiple values, it will appear as a Dynamic Array (usable with lists and DataFrames).
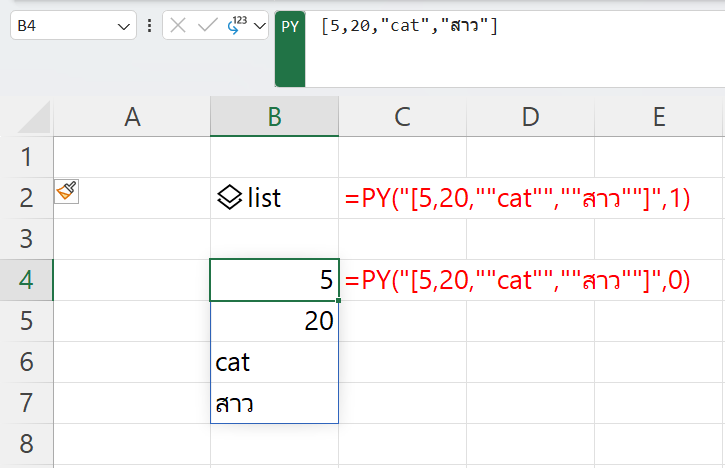
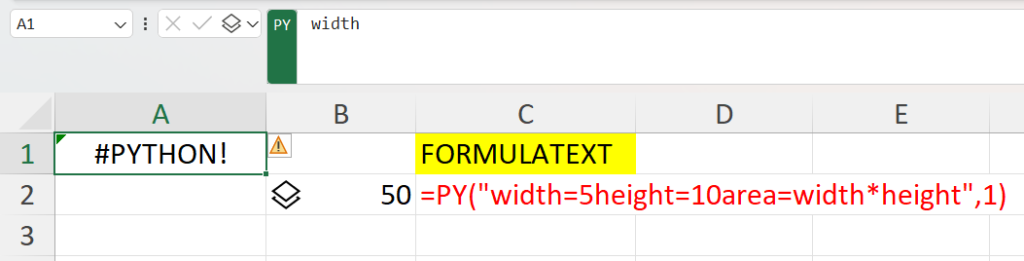
Note: I use the Excel function FORMULATEXT to display Python formulas.
- ,1 at the end indicates that the result is a Python Object.
- ,0 at the end indicates that the result is an Excel value.
Declaring Variables in Python
You can declare variables in Python like this:
variable1 = some_expression variable2 = some_expression …
Python assigns the value on the right to the variable on the left. For example:
width = 5

height = 10

area = width * height
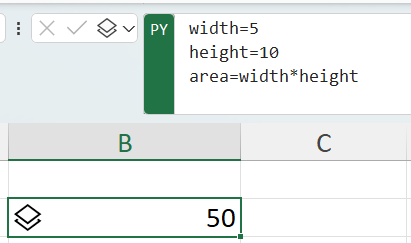
By default, it will display the value of the last line, so in this example, it will show the value 50 for the ‘area’ variable.
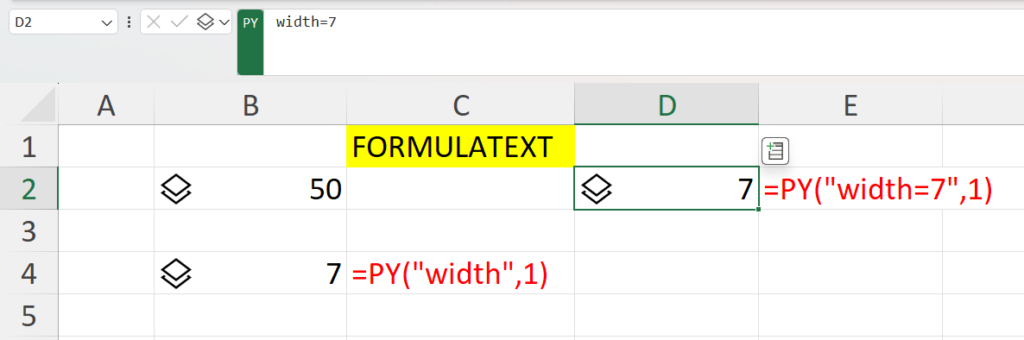
Referencing Variables in Other Cells
You can reference variables declared in other cells, but they must be in cells above the current one.
Python reads values from Row 1, moving from left to right in every column, before moving to Row 2.
For example, B4 can access the ‘width’ variable because it was declared in B2.
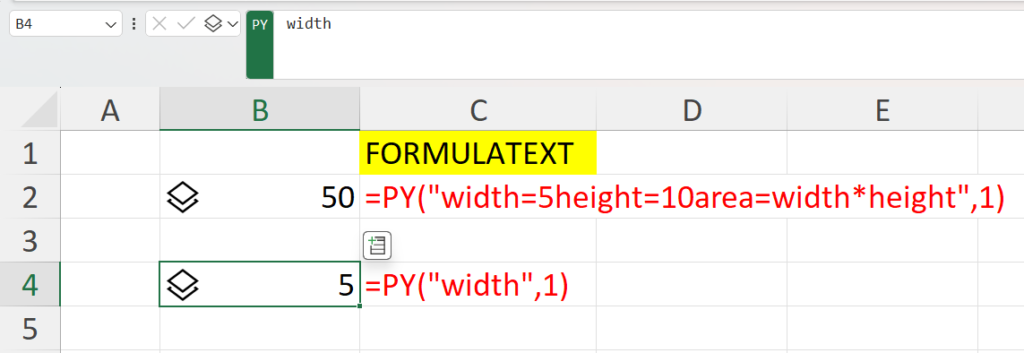
However, A1 cannot access ‘width’ because it tries to do so before 'width' is declared in B2.
If you declare 'width 'again in D2, it will read the value as 7, overriding the previous declaration in B2.
How to Reference Data from Excel into Python
You can reference data from Excel into Python using cell references, defined names, or even query names.
1.Referencing a Single Cell
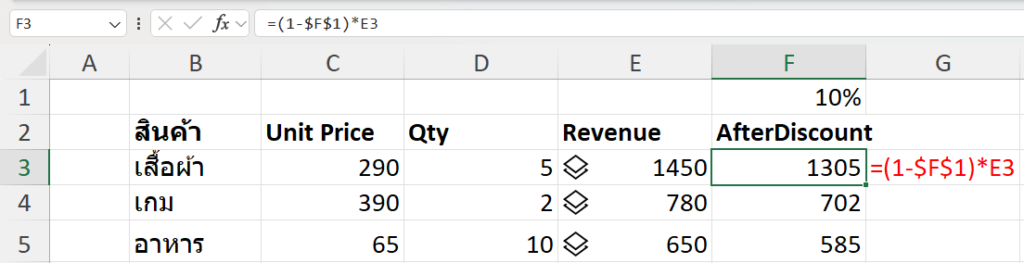
The first way is to click on the cell you want to reference, and it will automatically create an “xl” function (which is a special function for reading values from Excel) along with the cell reference. For example,
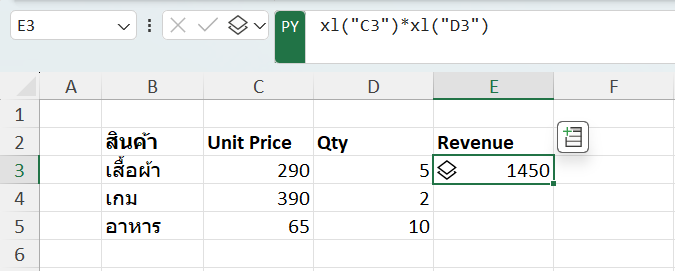
You can then copy this formula to move the cell reference as needed or lock it using “$.”
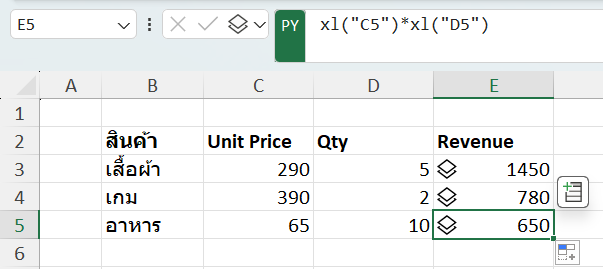
You can also use Excel formulas or functions to calculate values based on Python data.
However, referencing a single cell is not very useful and not commonly used.
2.Referencing a Range
Python in Excel becomes more useful when you reference data as a range.
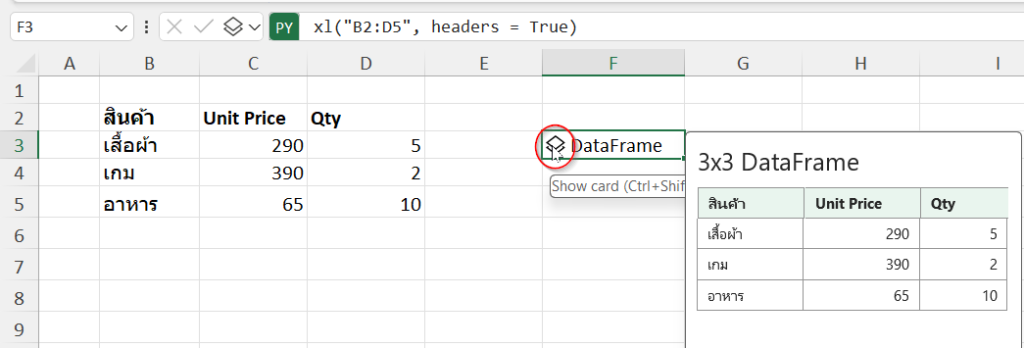
For example, if you have data in the “Unit Price” and “Qty” columns, you can reference the entire range (B2:D5) like this (including headers with headers=True).
When multiple data sets are entered, the result will be a DataFrame, an object from the Pandas library in Python, similar to an Excel table or array, which is very powerful.
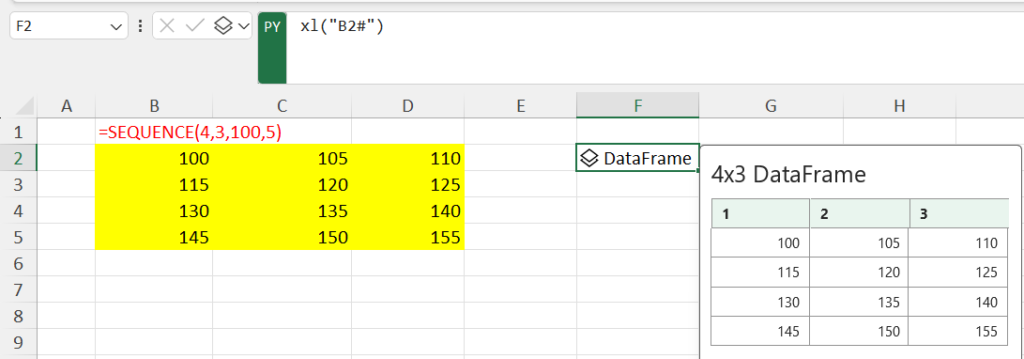
3.Referencing a Dynamic Array
If you have a dynamic array, you can click on the top-left cell and use the "#" symbol after the cell reference as usual.
4.Referencing a Table
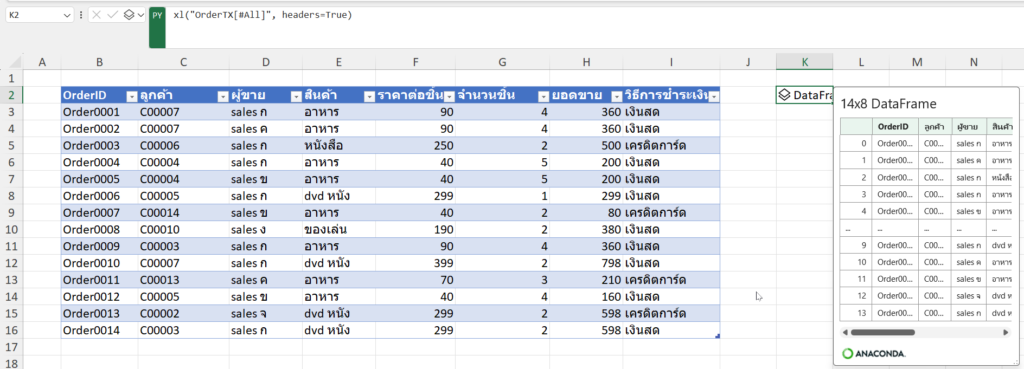
You can select an entire table and bring it into a DataFrame. It’s better than referencing a range because a table automatically expands to accommodate new data.
The Python formula for this will look something like this, including table headers:
xl("TableName[#All]", headers=True)
5.Bringing Results from Power Query
To bring data from Power Query into Python, you need to get data from a source other than “CurrentWorkbook.”
For example, you can get data from a CSV file hosted on the web. First, use the “Get Data from Web” option and enter the URL (https://raw.githubusercontent.com/ThepExcel/YouTube/main/SampleData.csv). Load it as “Connection Only.”
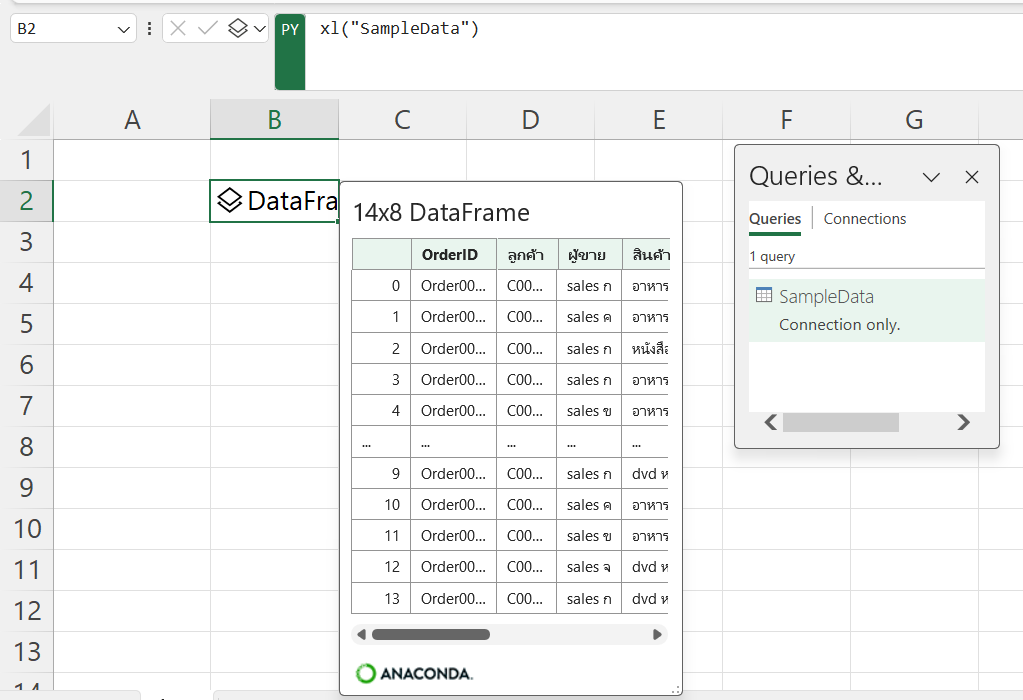
When you want to use it in Python, you can type "xl(" and it will display all available queries.
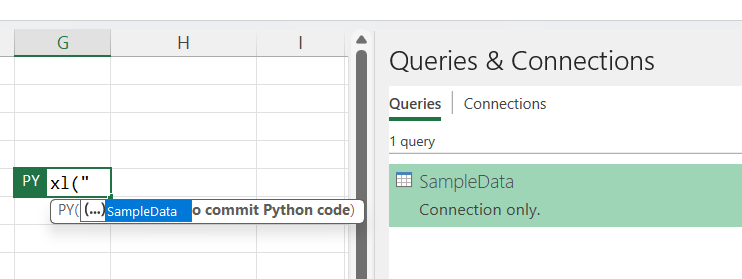
Select the one you want, and it will bring the data into a DataFrame. That’s it
Exploring Python DataFrames
Once we have a DataFrame in Python, we can manipulate it in various ways, such as summarizing data, viewing column names, selecting specific columns, adding new columns, and filtering data.
Basic Summarization
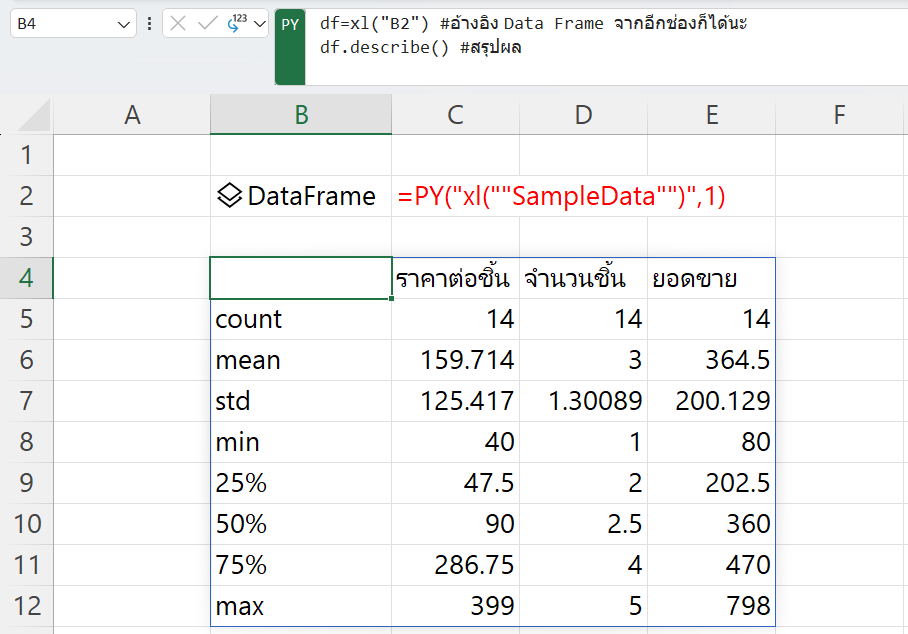
A DataFrame has built-in functions, or methods, one of which is called “describe.” This method can automatically summarize data from all numeric columns, which is very convenient. For example:
df = xl("B2") # Referencing a DataFrame from another cell

df.describe() # Summarizing the data
P.S. In Python, you can comment code using the “#” symbol.
If you want the results to display directly in an Excel cell, you’ll need to change how the results are shown from a Python Object to an Excel Value. The results will then be displayed as a Dynamic Array in Excel.
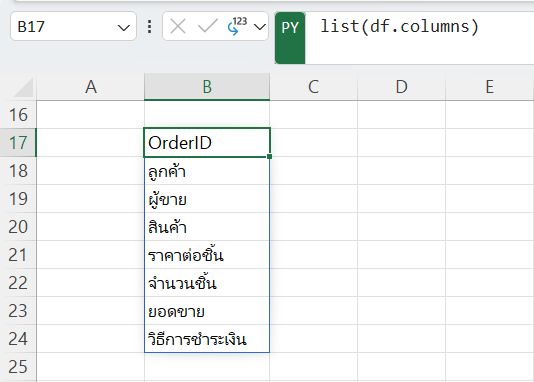
Viewing All Column Names
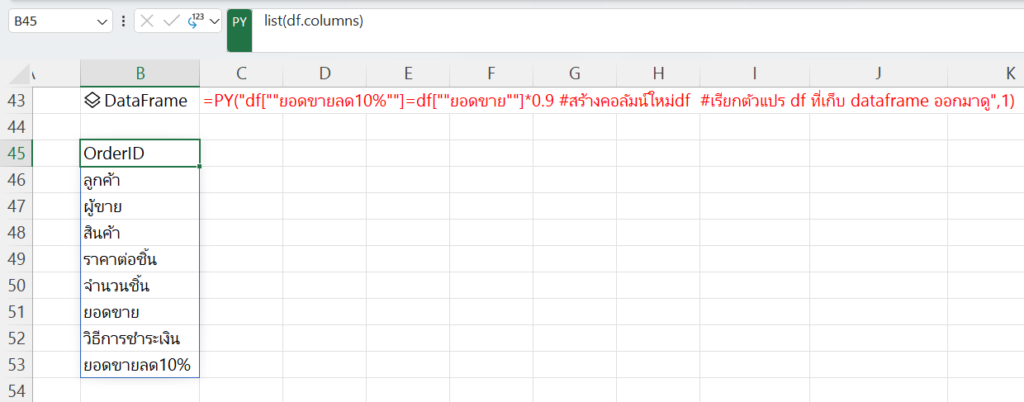
To obtain a list of all column names in a DataFrame, you can use a command like this to retrieve the column names as a list:
list(df.columns)
Selecting Specific Columns
You can select specific columns in a DataFrame using the following command:
DataFrameName[ List Column Name ]
For example:
df[["OrderID","Product","Sales"]]

df[["OrderID","สินค้า","ยอดขาย"]]
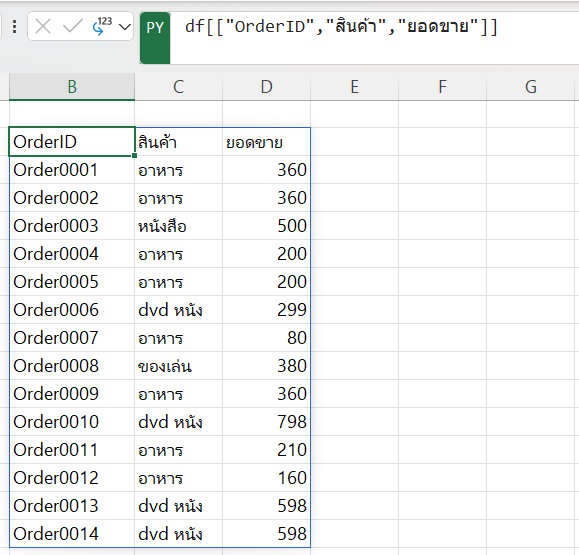
This will result in a DataFrame that includes only the specified columns.
If you want to view df[["OrderID","สินค้า","ยอดขาย"]] without assigning it back to the variable df, it won’t modify the original df DataFrame in any way. However, if you add new columns as shown next, it will modify the original DataFrame.
Adding New Columns
You can add a new column to the DataFrame using a formula like this:
df["Column Name"] = FormulaFor example:
df["ยอดขายลด10%"]=df["ยอดขาย"]*0.9 #สร้างคอลัมน์ใหม่ # Creating a new column
df  #เรียกตัวแปร df ที่เก็บ dataframe ออกมาดู  # Viewing the df variable containing the DataFrame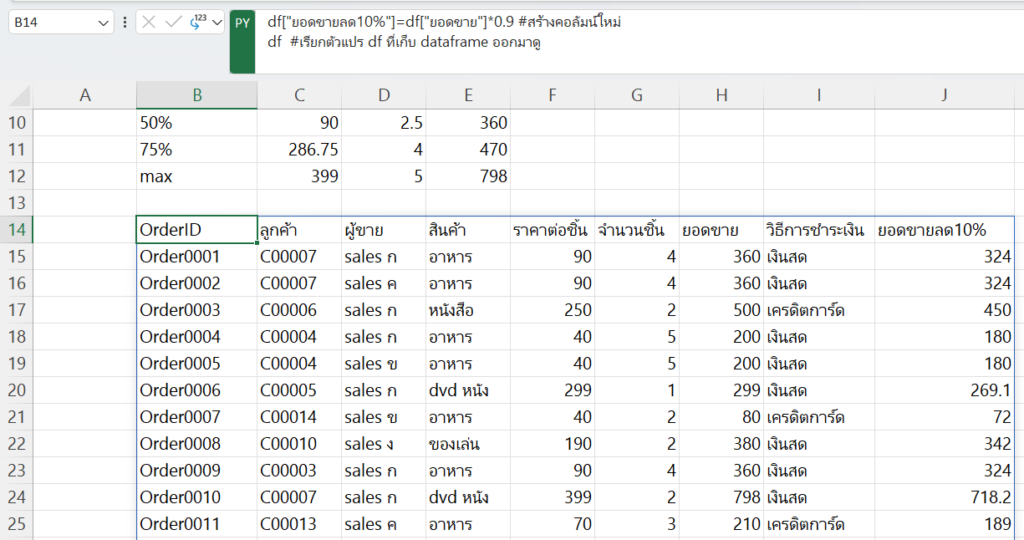
If you look at the column names again, you will see that the df DataFrame now has a new column.
Filtering DataFrames
Filtering DataFrames can be done in various ways, but one common method is to create a True-False Series, similar to using the FILTER function.
Typically, when you reference a single column in a DataFrame, it becomes a Series, like this:
df["Payment Method"]
df["วิธีการชำระเงิน"]
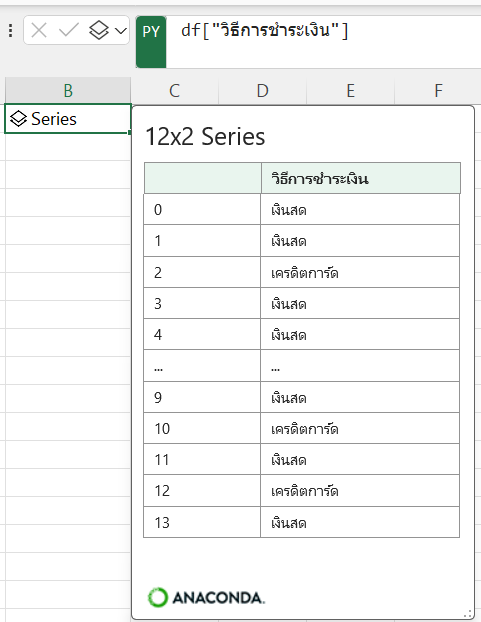
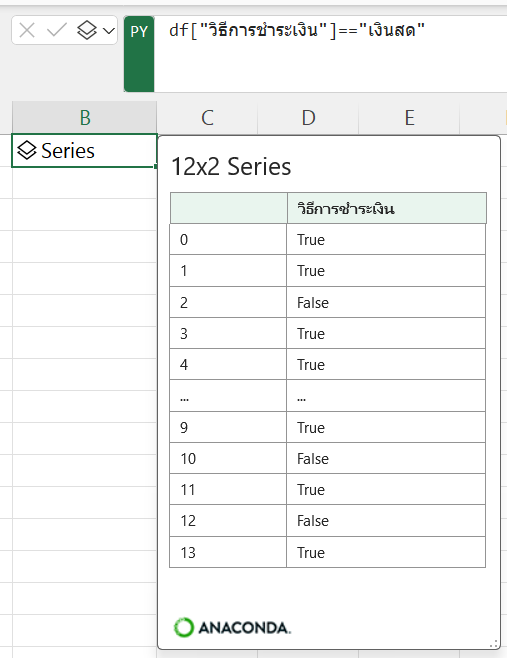
This results in a set of data with an index on the left, similar to a Series. You can use this Series for calculations or comparisons to create a new Series with True and False values. For example, if you want to filter data where the payment method is “Cash,” you can do the following:
df["Payment Method"] == "cash"
df["วิธีการชำระเงิน"]=="เงินสด"
In Python, you use == for comparison, not just =.
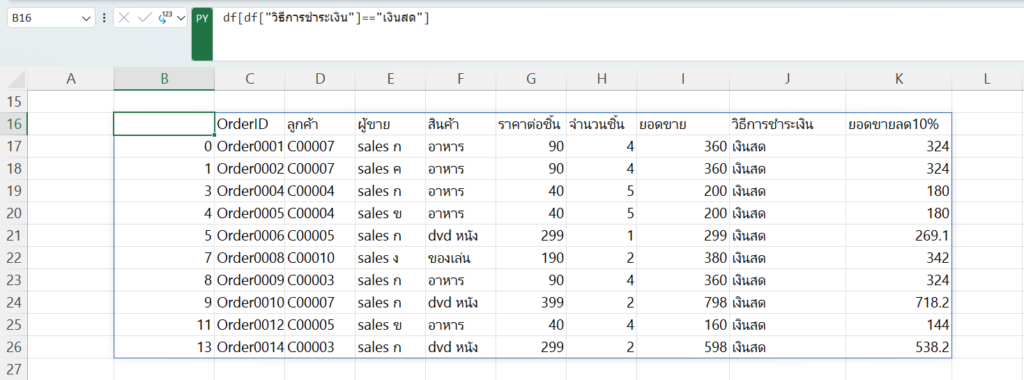
Then, if you apply this True-False Series to the original DataFrame:
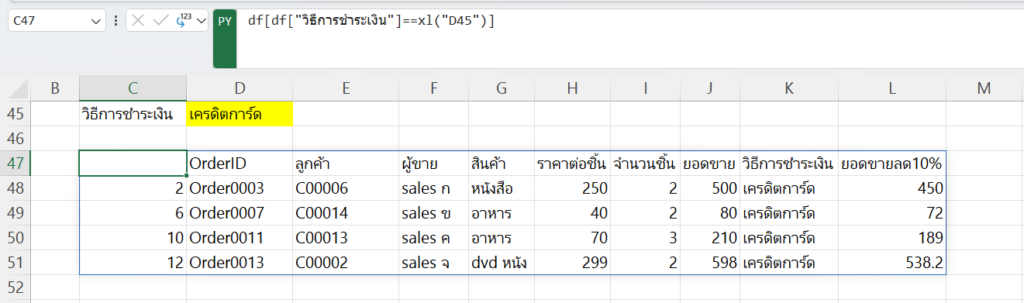
df[df["Payment Method"] == "cash"]
df[df["วิธีการชำระเงิน"]=="เงินสด"]
You will be able to filter the data (you’ll see that there’s a 10% sales discount).
If you want to apply multiple conditions, you can use & (and) or | (or) operators and enclose each condition in parentheses. For example:
df[(df["Payment Method"] == "cash") & (df["Quantity"] > 3)]
df[(df["วิธีการชำระเงิน"]=="เงินสด") & (df["จำนวนชิ้น"]>3)]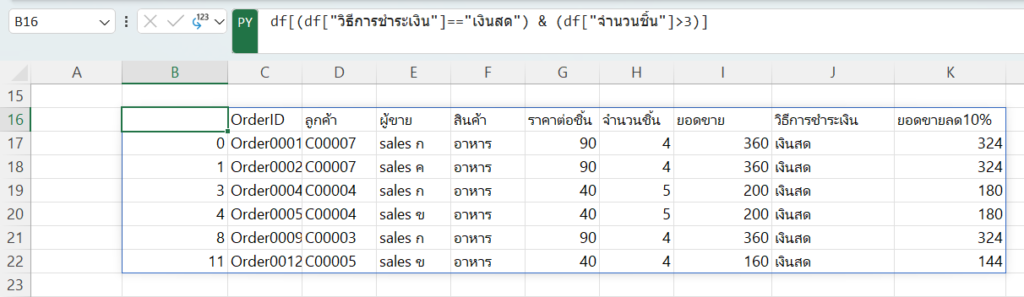
You can store the filtered data in a new variable or overwrite the original DataFrame. In this example, it’s stored in cashGT3_DF.
ป.ล. ในตัวแปร df ก็ยังคงมีครบทุกแถวอยู่นะ
cashGT3_DF = df[(df["Payment Method"] == "cash") & (df["Quantity"] > 3)]
cashGT3_DF=df[(df["วิธีการชำระเงิน"]=="เงินสด") & (df["จำนวนชิ้น"]>3)]
Combining with Dropdown Lists
Certainly, we can combine these with the use of a Dropdown List to make the filtering of data dynamic (if desired).
Select “Cash”
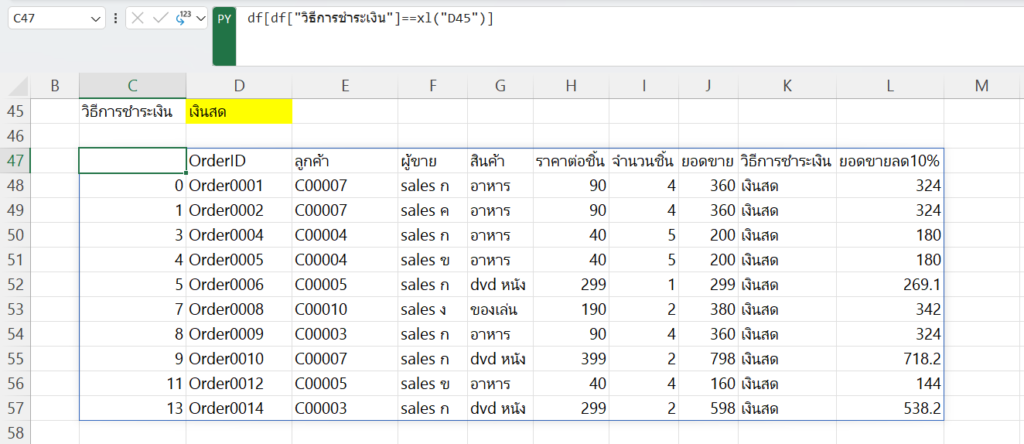
Select “Credit”
Summary of Basic Operations:
You can perform preliminary summaries using Group By, which allows you to find sums, counts, maximums, minimums, and more. Here’s how:
df.groupby(column_name_to_group_by)
df.groupby(ชื่อคอลัมน์ที่จะ group)
This will give you a special object representing the grouped data. To see the results, you’ll need to apply an aggregation function, like this:
df.groupby(column_name_to_group_by)[column_to_summarize].aggregation_function
df.groupby(ชื่อคอลัมน์ที่จะ group)[คอลัมน์ที่จะสรุป].วิธีสรุป
Or you can specify multiple columns to summarize:
df.groupby(column_name_to_group_by)[[list_of_columns_to_summarize]].aggregation_function
df.groupby(ชื่อคอลัมน์ที่จะ group)[ list คอลัมน์ที่จะสรุป ].วิธีสรุป
For example:
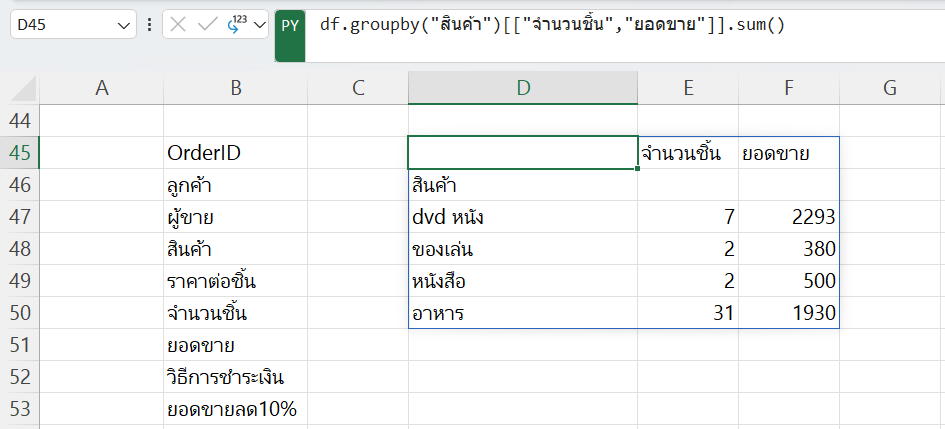
df.groupby("Product")[["Quantity", "Sales"]].sum()
df.groupby("สินค้า")[["จำนวนชิ้น","ยอดขาย"]].sum()
Other summarization methods include:
- size() = Count of rows.
- count() = Count of non-empty values.
- first() = First value.
- last() = Last value.
- sum() = Sum of values.
- min() = Minimum value.
- max() = Maximum value.
- median() = Median value.
You can also perform multiple summarizations at once using:
df.groupby(column_name_to_group_by)[[list_of_columns_to_summarize]].aggregate(list_of_aggregation_functions)
df.groupby(ชื่อคอลัมน์ที่จะ group)[ list คอลัมน์ที่จะสรุป].aggregate(listวิธีสรุป)
For example:
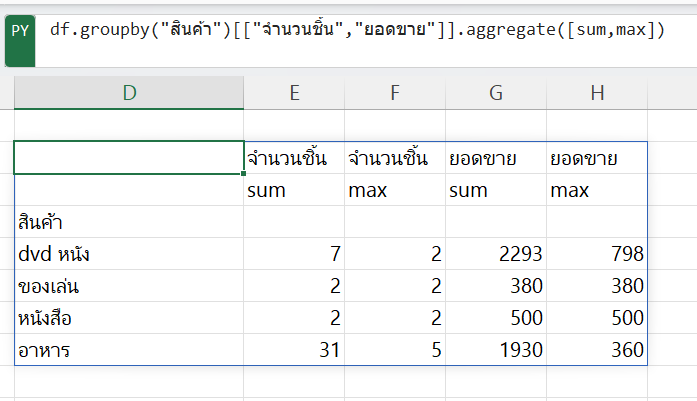
df.groupby("Product")[["Quantity", "Sales"]].aggregate([sum, max])
df.groupby("สินค้า")[["จำนวนชิ้น","ยอดขาย"]].aggregate([sum,max])
Or using the shorter agg notation:
df.groupby("Product")[["Quantity", "Sales"]].agg([sum, max])
df.groupby("สินค้า")[["จำนวนชิ้น","ยอดขาย"]].agg([sum,max])
Creating Basic Graphs:
Basic graphs that don’t require special libraries.
To create basic graphs without special libraries, you can use .plot and specify the graph type. For example:
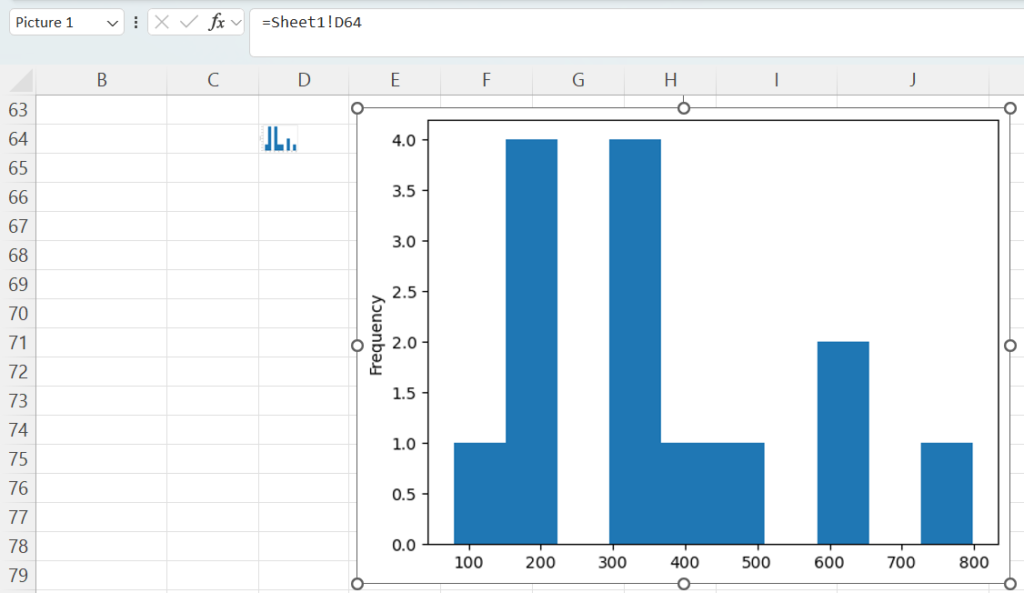
df["Sales"].plot.hist()
df["ยอดขาย"].plot.hist()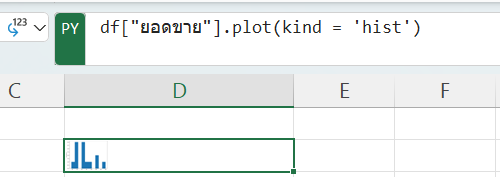
This creates a histogram of the “Sales” column. The resulting image may appear as a small plot in the cell.
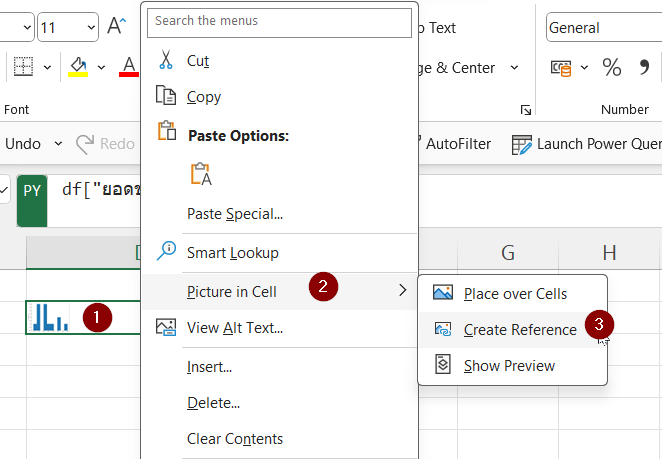
To view the image more prominently, you can:
- Enlarge the cell.
- Merge cells.
- Right-click and select “Picture In Cell” -> “Create Reference” (recommended).
จะมีการสร้างภาพใหญ่ขึ้นมาอีกอัน ที่ link ค่าจาก cell ผลลัพธ์อีกที
Other types of graphs you can create include area, bar, barh (horizontal bar), box, density, hexbin, hist (histogram), kde (kernel density estimate), line, pie, scatter, and more.
For example, to create a bar chart showing the total sales of each product after grouping:
dfProductSales=df.groupby("Product")["Sales"].sum()
dfProductSales.plot.bar()
dfProductSales=df.groupby("สินค้า")["ยอดขาย"].sum()
dfProductSales.plot.bar()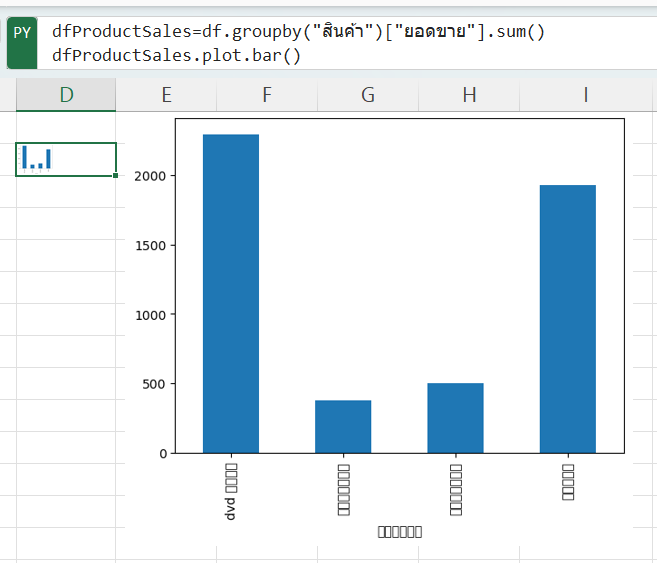
Note: To display Thai text correctly in plots, you need to set the font family to one that supports Thai characters, like “Sarabun-Regular.ttf,” and adjust the font size as needed:
plt.rcParams['font.family']='Sarabun-Regular.ttf'
plt.rcParams['font.size']=18

dfProductSales=df.groupby("สินค้า")["ยอดขาย"].sum()
dfProductSales.plot.bar()
If the Python system you’re using doesn’t have the required Thai font, you may need to install it. However, installing Thai fonts in Python environments running on cloud services like Anaconda with Microsoft can be more challenging.
Creating Advanced Graphs with Seaborn
Seaborn is a Python library that allows you to create beautiful and customizable graphs more easily than conventional methods. It also provides an easier way to set different themes for your graphs.
To use Seaborn, you need to import the library (you only need to do this once):
import seaborn as snsUsing “as sns” is a way to give it a shorter nickname, making it easier to use without typing the full name each time.
For example:
import seaborn as sns
sns.set_theme(style="dark", palette="pastel")
boxplot = sns.boxplot(x="Payment Method", y="Sales", data=df)

import seaborn as sns
sns.set_theme(style="dark", palette="pastel")
boxplot = sns.boxplot(x="วิธีการชำระเงิน", y="ยอดขาย", data=df)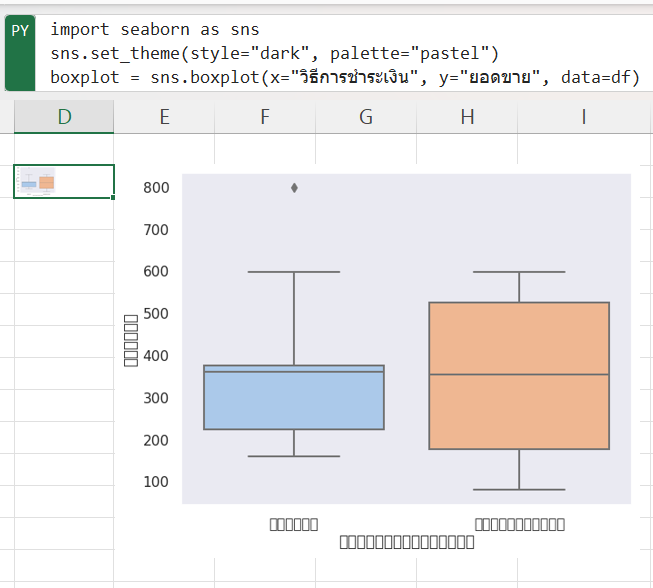
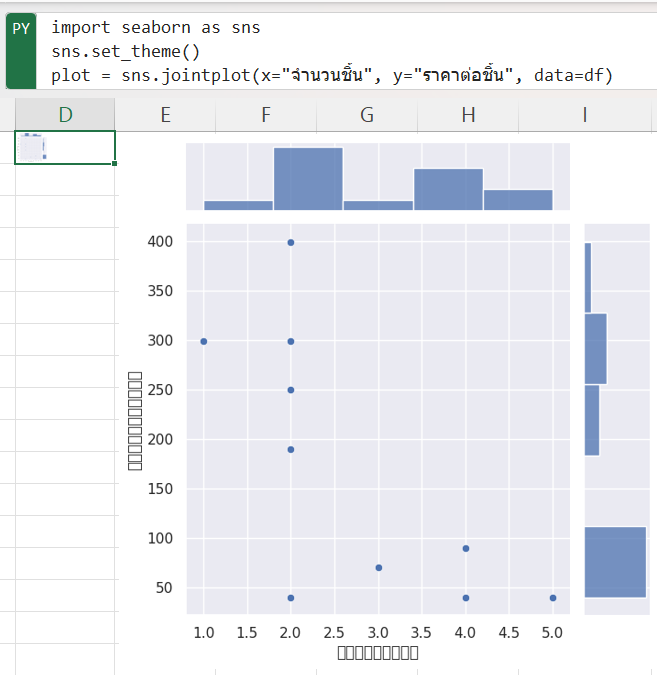
Seaborn supports various types of unusual graphs as well, such as JointPlot.
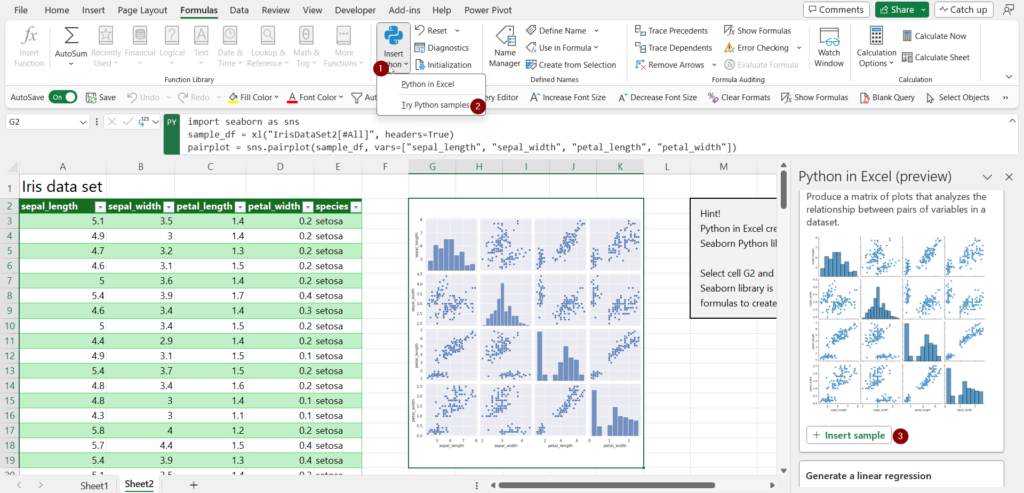
If you want to explore interesting plotted data, you can check out sample datasets provided by Microsoft.
You can access them following the image link, and you can use Seaborn’s Pairplot to create scatter plots across multiple columns.
If you’re still not satisfied and want to explore more types of graphs, you can find additional examples here: https://seaborn.pydata.org/examples/index.html
Reference: https://www.thepexcel.com/python-in-excel-ep01/


